Quartile Calculator
This quartile calculator sorts your data and finds Q1, the median (Q2), Q3 and the interquartile range. Q1 is the median of the lower half and Q3 the median of the upper half: for 1, 3, 5, 7, 9, 11 and 100 they are 3 and 11.
Sources: OpenStax Introductory Statistics 2e Updated
Quartiles
Q1 = 15, Q2 = 40, Q3 = 43
- Interquartile range (IQR)
- 28
- Minimum
- 6
- Maximum
- 49
- Range
- 43
- 1.5 × IQR fences
- −27 and 85
- Values outside the fences
- none
Show steps Here’s how we got it
Put the values in order, smallest first
6, 7, 15, 36, 39, 40, 41, 42, 43, 47, 49
Find the median (Q2)
There are 11 values, so the median is the 6th one: 40
Split the data into a lower half and an upper half
Lower half: 6, 7, 15, 36, 39
Upper half: 41, 42, 43, 47, 49
With an odd number of values, this method leaves the median out of both halves.
Q1 is the median of the lower half
There are 5 values, so the median is the 3rd one: 15
Q3 is the median of the upper half
There are 5 values, so the median is the 3rd one: 43
Subtract to get the interquartile range
IQR = Q3 − Q1 = 43 − 15 = 28
The IQR is the spread of the middle half of the data.
The quartile method
Sort the data, then, as in OpenStax Introductory Statistics:
With an even number of values, the two halves are simply the first half and the second half. With an odd number, the middle value is the median, and the methods disagree about where it goes:
| Method | Odd number of values | Where it is used |
|---|---|---|
| Median left out | The median belongs to neither half. | OpenStax Introductory Statistics; many school courses |
| Median included | The median is counted in both halves. | Some textbooks (sometimes called Tukey's hinges) |
| Linear interpolation | Rank = p × (n − 1) + 1, then interpolate between neighbours. | Spreadsheet QUARTILE.INC functions |
How to find quartiles and outliers
Find the quartiles of 1, 3, 5, 7, 9, 11 and 100 with the default method, and check whether 100 is an outlier.
Put the values in order, smallest first
1, 3, 5, 7, 9, 11, 100
Find the median (Q2)
There are 7 values, so the median is the 4th one: 7
Split the data into a lower half and an upper half
Lower half: 1, 3, 5
Upper half: 9, 11, 100
With an odd number of values, this method leaves the median out of both halves.
Q1 is the median of the lower half
There are 3 values, so the median is the 2nd one: 3
Q3 is the median of the upper half
There are 3 values, so the median is the 2nd one: 11
Subtract to get the interquartile range
IQR = Q3 − Q1 = 11 − 3 = 8
The IQR is the spread of the middle half of the data.
Answer: Q1 = 3, Q2 = 7, Q3 = 11
The upper fence is Q3 + 1.5 × IQR = 11 + 1.5 × 8 = 23. The value 100 is above it, so the 1.5 × IQR rule flags it as an outlier.
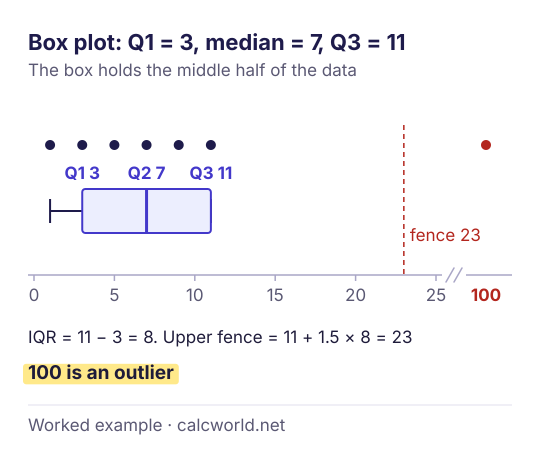
The quartiles hardly notice the 100: replace it with 13 and Q3 is still 11. The mean and the standard deviation do notice it, which is why skewed data is often summed up with the median and the IQR instead.
Why quartile methods give different answers
Take the calculator's default data, 11 values from 6 to 49. The median is 40 under every method, but Q1 and Q3 move depending on what happens to that middle value.
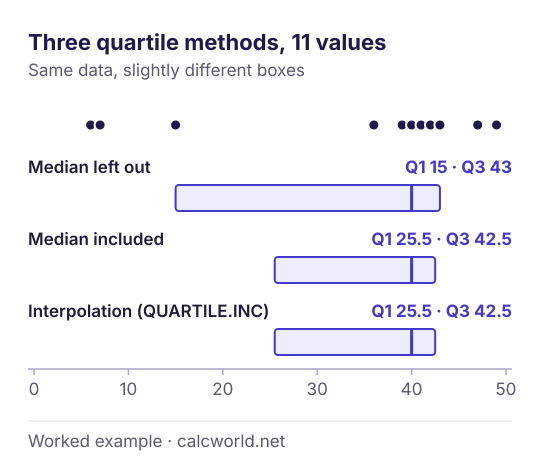
The interpolation method treats Q1 and Q3 as the 25th and 75th percentiles, with the same rank formula as the percentile calculator. The gap between methods shrinks as the data set grows.
Quartile practice question
Find Q1, the median, Q3 and the interquartile range of 12, 15, 11, 18, 20, 14, 17 and 13.
Check your answer
Answer: Q1 = 12.5, Q2 = 14.5, Q3 = 17.5
Put the values in order, smallest first
11, 12, 13, 14, 15, 17, 18, 20
Find the median (Q2)
There are 8 values, so take the mean of the 4th and 5th: (14 + 15) ÷ 2 = 14.5
Split the data into a lower half and an upper half
Lower half: 11, 12, 13, 14
Upper half: 15, 17, 18, 20
With an even number of values the data splits cleanly down the middle.
Q1 is the median of the lower half
There are 4 values, so take the mean of the 2nd and 3rd: (12 + 13) ÷ 2 = 12.5
Q3 is the median of the upper half
There are 4 values, so take the mean of the 2nd and 3rd: (17 + 18) ÷ 2 = 17.5
Subtract to get the interquartile range
IQR = Q3 − Q1 = 17.5 − 12.5 = 5
The IQR is the spread of the middle half of the data.
Questions about quartiles
How do you find the quartiles of a data set?
Put the values in order and find the median. That is Q2. Split the data into a lower half and an upper half. The median of the lower half is Q1 and the median of the upper half is Q3.
Why do different calculators give different quartiles?
There is more than one accepted method. They differ in what to do with the median when the number of values is odd, and in whether to interpolate between values.
For 6, 7, 15, 36, 39, 40, 41, 42, 43, 47, 49, leaving the median out of the halves gives Q1 = 15 and Q3 = 43, while including it gives Q1 = 25.5 and Q3 = 42.5. Use the method your course or software uses.
Which method does this calculator use by default?
The median of each half with the overall median left out, which is the method in OpenStax Introductory Statistics and in many school courses. The Method menu also offers the version that includes the median in both halves and the linear interpolation used by spreadsheet QUARTILE.INC functions.
What is the interquartile range?
IQR = Q3 − Q1. It is the spread of the middle half of the data. Unlike the range, it is not affected by one unusually large or small value.
How do you use quartiles to find outliers?
A common rule flags any value below Q1 − 1.5 × IQR or above Q3 + 1.5 × IQR. The calculator shows these two fences and lists the values outside them.
Sources
- OpenStax Introductory Statistics 2e, 2.3 Measures of the Location of the Data — quartiles as the medians of the lower and upper halves, with the median left out of both halves (checked October 12, 2026)
- NIST/SEMATECH e-Handbook of Statistical Methods, 7.2.6.2 Percentiles — the rank 1 + p(N − 1) with linear interpolation, the method used by Excel, behind the interpolation option (checked October 12, 2026)